OLTP vs OLAP: The Core of Data Miscommunication
Why Data Producers and Consumers Don't Get Along
👋 Hi folks, thanks for reading my newsletter! My name is Chad Sanderson, and I write about data, data products, data modeling, and the future of data engineering and data architecture. In today’s article, I’m inviting Mark Freeman to share his experience in managing the relationship between data producers and consumers. Please consider subscribing if you haven’t already, reach out on LinkedIn if you ever want to connect, and join our Slack community Data Quality Camp for practitioner-led advice on Data Contracts and Data Quality at scale!
The reason why data producers and consumers struggle to communicate is deeper than the data— it’s tied to how we structure our data infrastructure. In my last role as a data scientist, I was hired at an HR tech company specifically to translate between the engineering and research teams, essentially turning analytics and I/O psychology theory into data products. Despite both teams having the same ultimate goal of building amazing HR data products, I experienced firsthand the breakdown of communication and misunderstanding of needs amongst these two groups through this translation work. Upon talking to others in the data industry I quickly learned that this challenge wasn’t unique to my job, but rather an endemic issue across data teams of various company sizes.
As a data scientist within the product team, my world centered around cloud data warehouses such as BigQuery, and I constantly found myself struggling to explain to engineering teams how the way they worked with data was different from the data science team. Through my time putting code into production within the engineering codebase and driving product decisions via analytics in the data warehouse, I came to the following conclusion: The reason why data producers and consumers struggle to understand each others’ needs is due to their interactions with data being drastically different given that they respectively work within OLTP or OLAP data systems.
In this article I expand on this realization by describing the nuances of OLTP and OLAP data systems, how these systems shape the “data worldview” of data producers and consumers, and finally sharing how we can meet each team where they are to build scalable data products. In addition, I present the fictitious situation of Sell Online Corp grappling with the differences in understanding data through an OLTP or OLAP lens to make this distinction tangible. Finally, please note that the data producer and consumer relationship can go well beyond the data warehouse, but this article focuses on this stage in the data lifecycle given how common it is.
OLTP vs OLAP
Surprisingly, many engineers and data professionals are quite knowledgeable of the tooling landscape, such as MongoDB, Postgres, and Snowflake, but fewer are aware of the OLTP and OLAP terminology. In short, OLTP stands for “online transaction processing” and OLAP stands for “online analytical processing.” Below is an excellent table created by
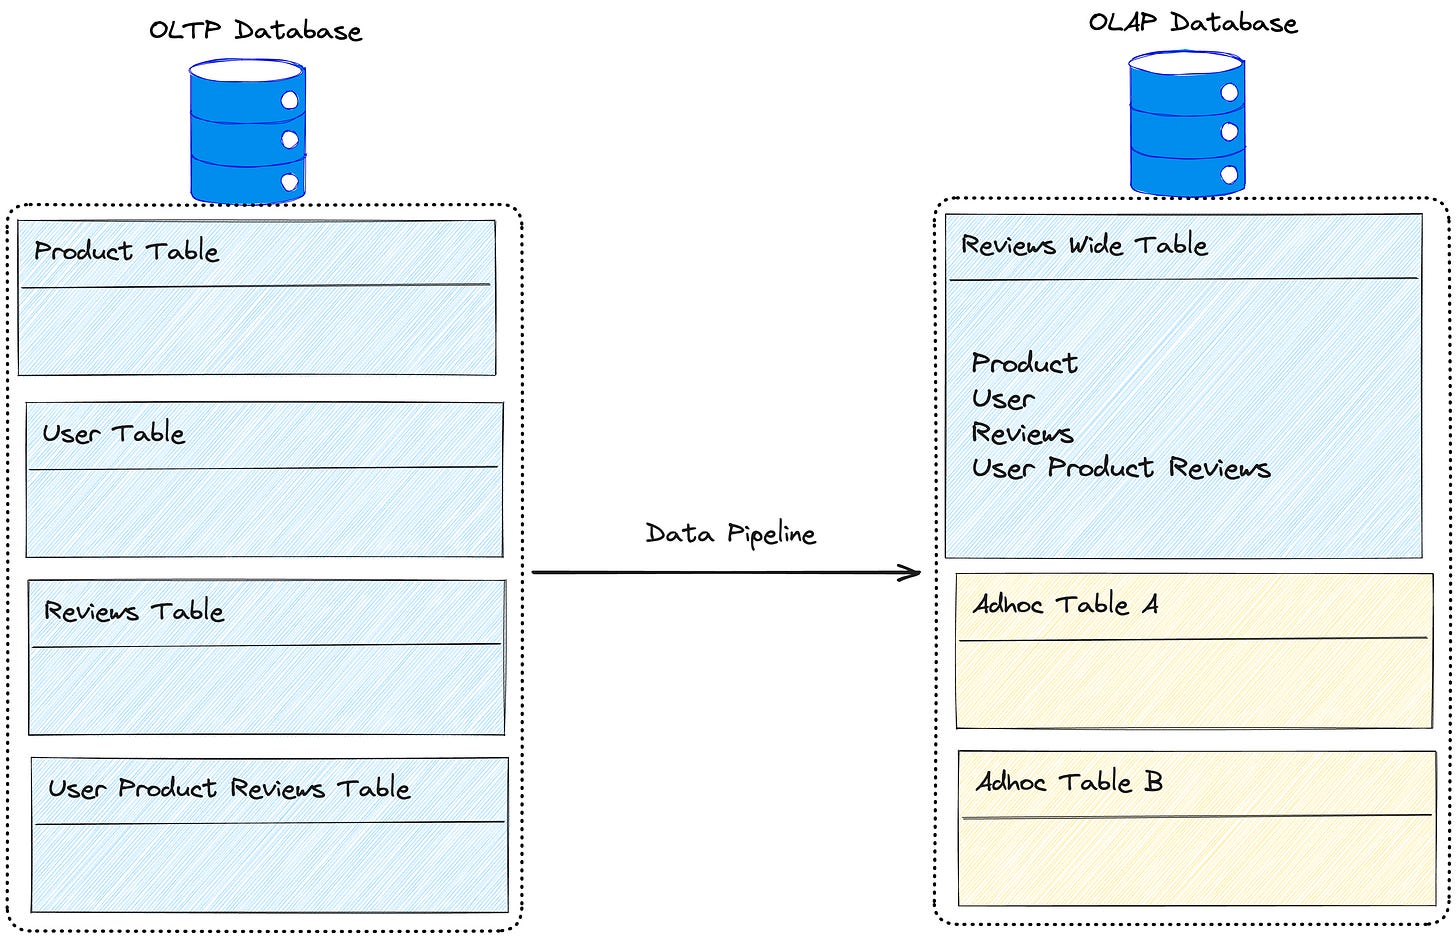
showing the difference between OLTP and OLAP databases (shared with his permission). I highly encourage checking out his article if you want to dive deeper into understanding this difference.OLTP data systems are typically the first and only database a company will have as it’s tied directly to the user actions associated with a product such as navigating an app, going through a workflow, or presenting information for a respective user. As a company grows and data increases, the business will start to ask questions about its own historical data. The OLTP system might be able to answer these questions but analytics workflows are expensive and require substantial transformations to make the data useful. To prevent the risk of taking down the critical role of OLTP systems for the live product, OLAP systems are utilized to replicate the data and utilize it for the expensive analytics processes. Thus, beginning the divide in data worldviews within the business.
To further drive this point, in this article, we will utilize the fake company Sell Online Corp to illustrate how data perspectives differ. In this use case, Sell Online Corp needs to present to their board how their major push for user reviews of products led to increased sales. This is a deceptively simple question that often uncovers the gaps in which different teams understand the semantics of their data.
OLTP Perspective: Need for Speed
There are three major components to consider for the OLTP side of data:
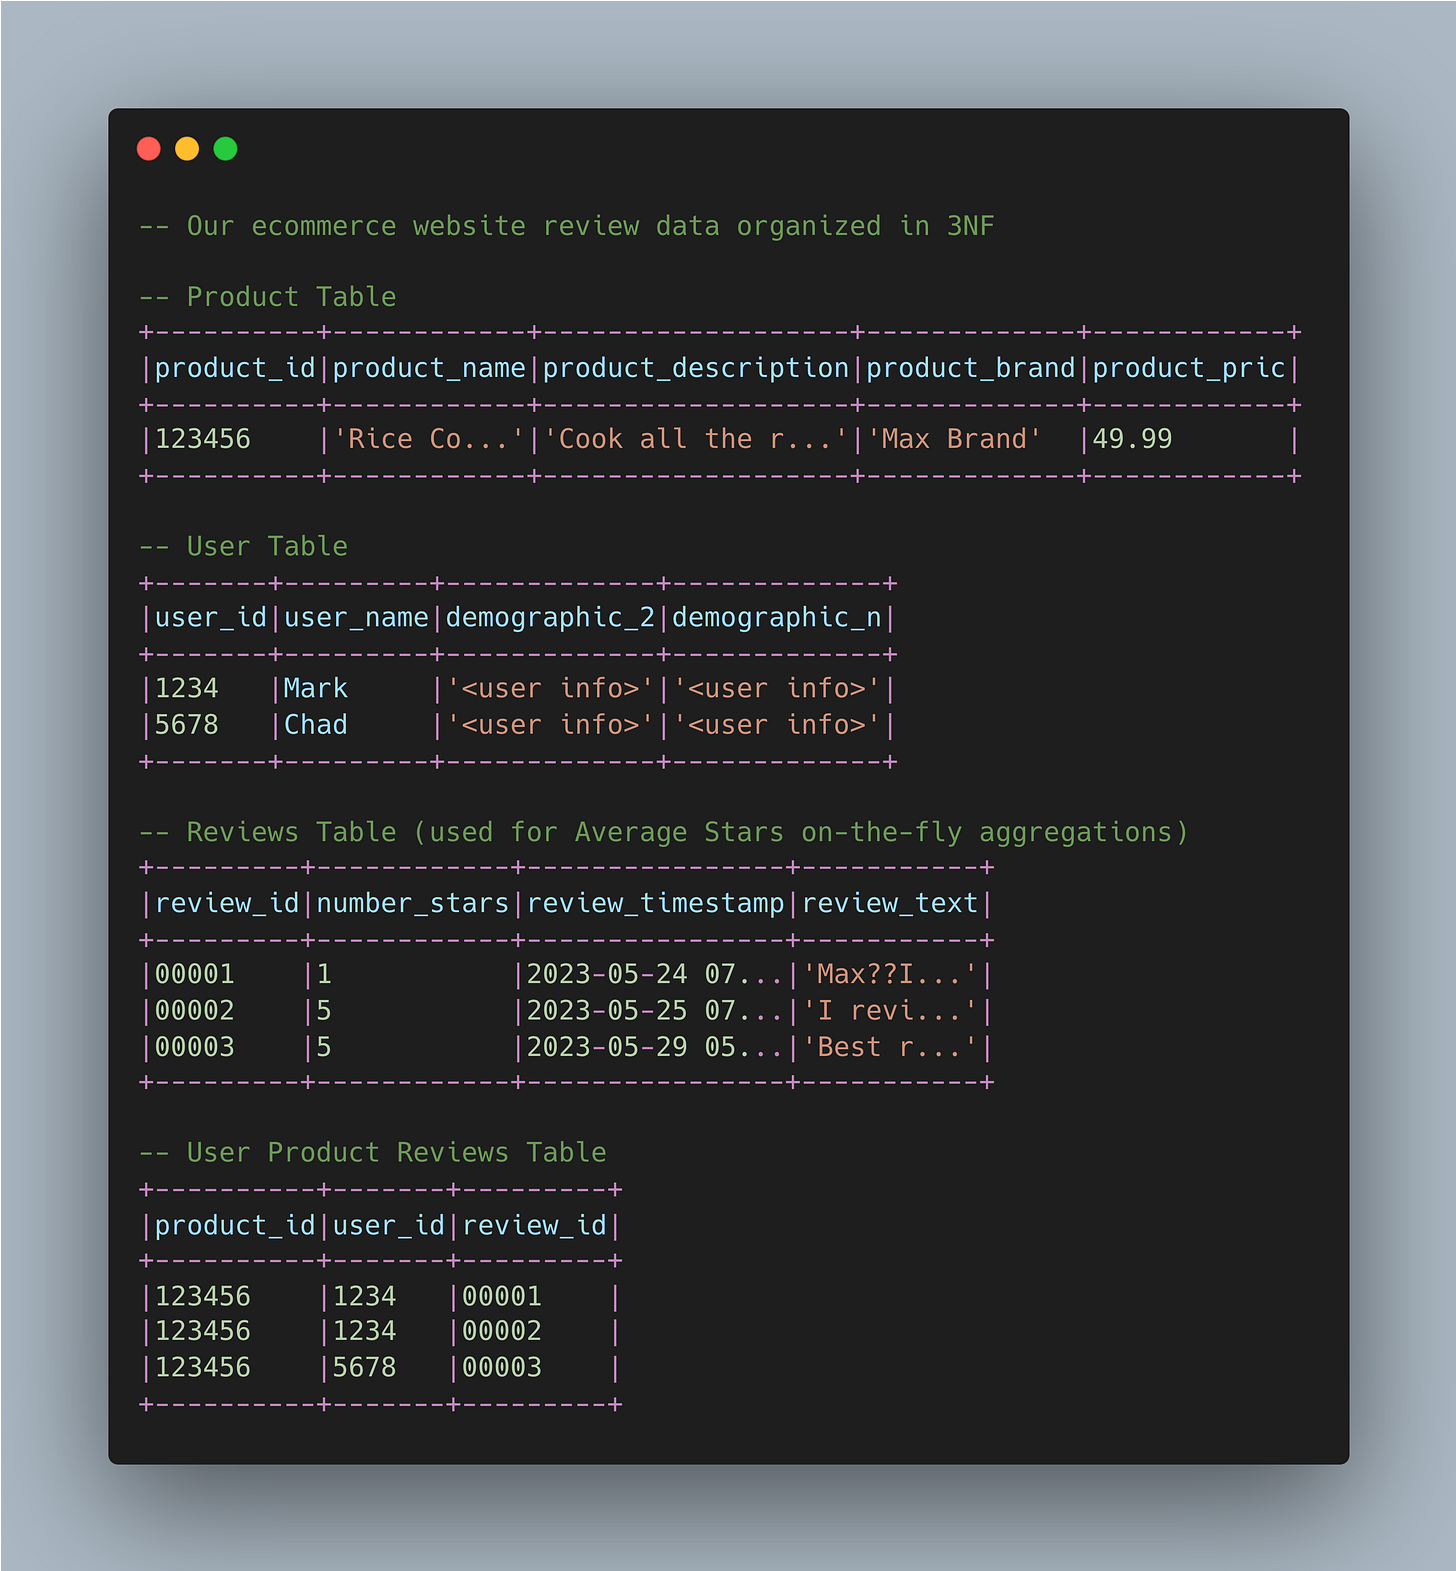
Data within an OLTP relational database should be in third-normalized form (3NF).
There is an emphasis on create, read, update, and delete (CRUD) tasks.
The database upholds atomicity, consistency, isolation, and durability (ACID)
These three major components ensure that there is low latency for information retrieval for serving the end user as quickly as possible while also being reliable.
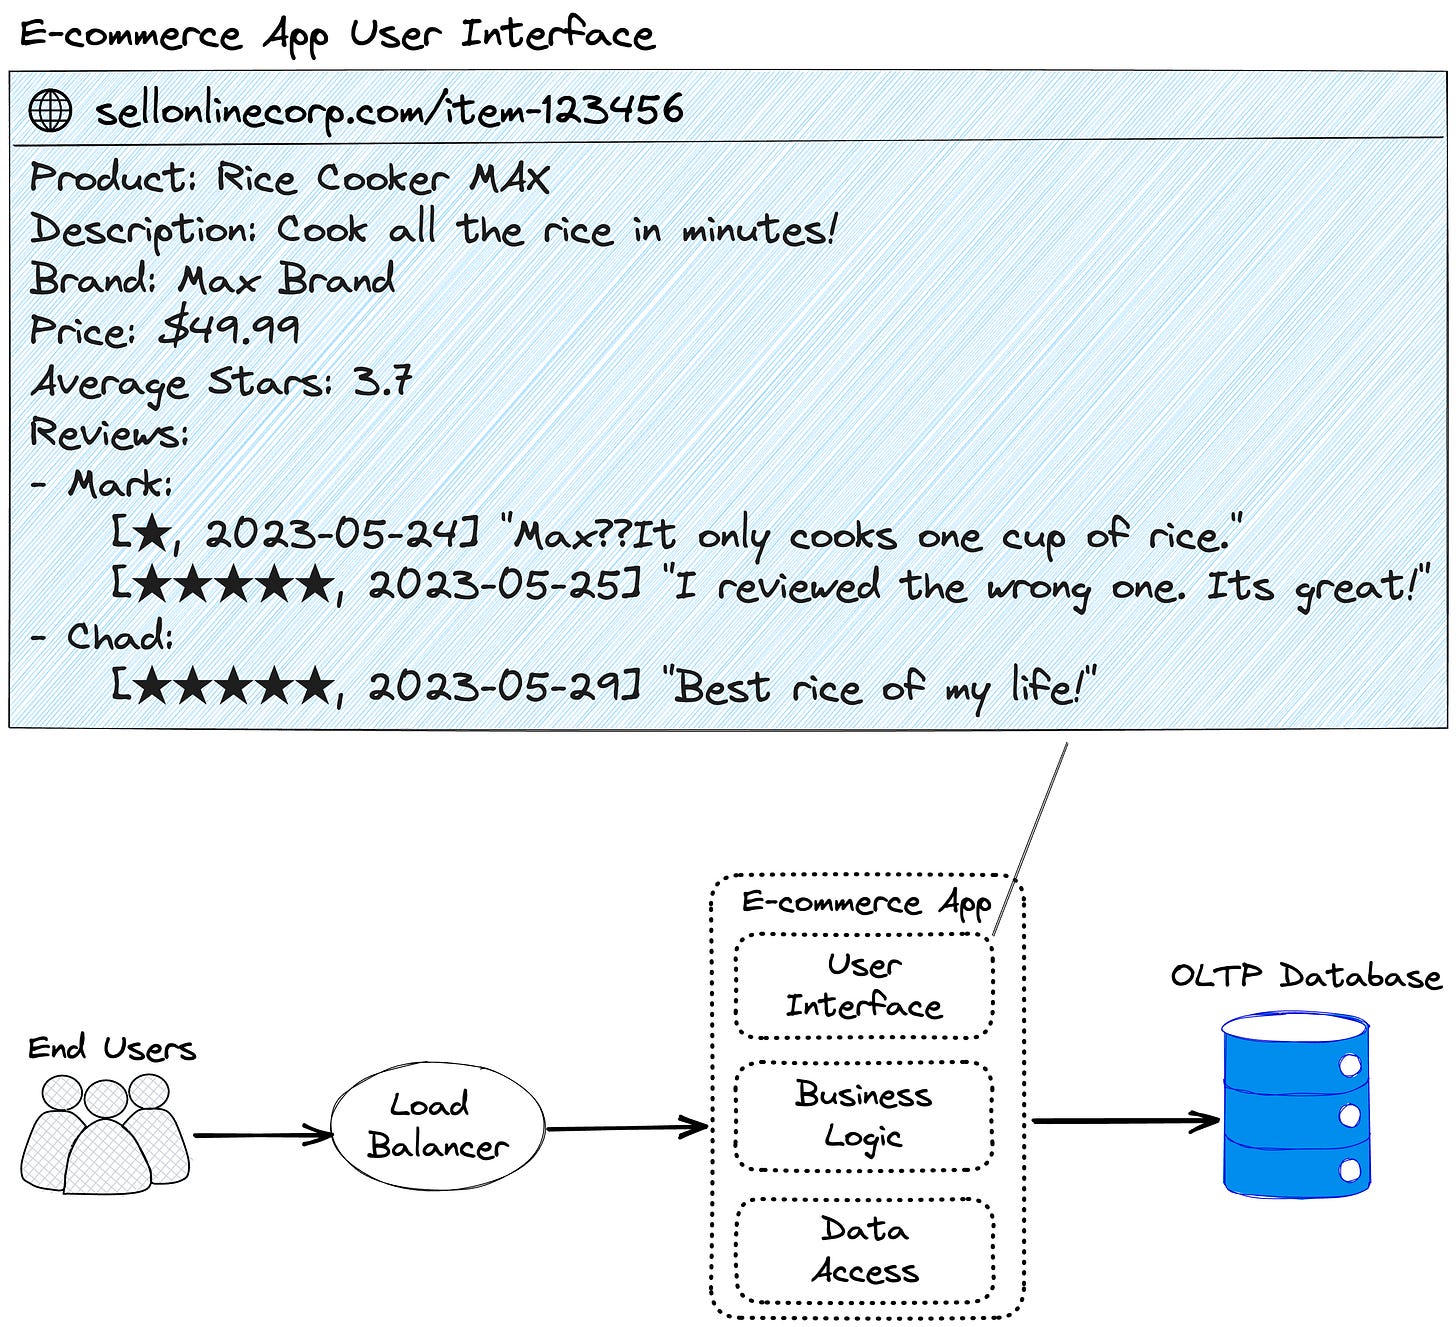
For our use case of Sell Online Corp, we are going to utilize a monolith e-commerce architecture for its simplicity, as our focus is on data architecture rather than software architecture. Below is an example of what data the end user sees when viewing an item for purchase and the simple infrastructure behind it:
In the above example, our data infrastructure needs to quickly:
Present information about a specific product such as descriptions and price.
Determine the average stars for an item based on reviews.
Present the reviews in chronological order grouped by user.
Allow the user to write reviews and append updated reviews.
To achieve the above requirements, the data in third-normalized form would look the like the following tables within the OLTP database, with Average Stars being generated via on-the-fly aggregations:
OLAP Perspective: Answering Big Questions
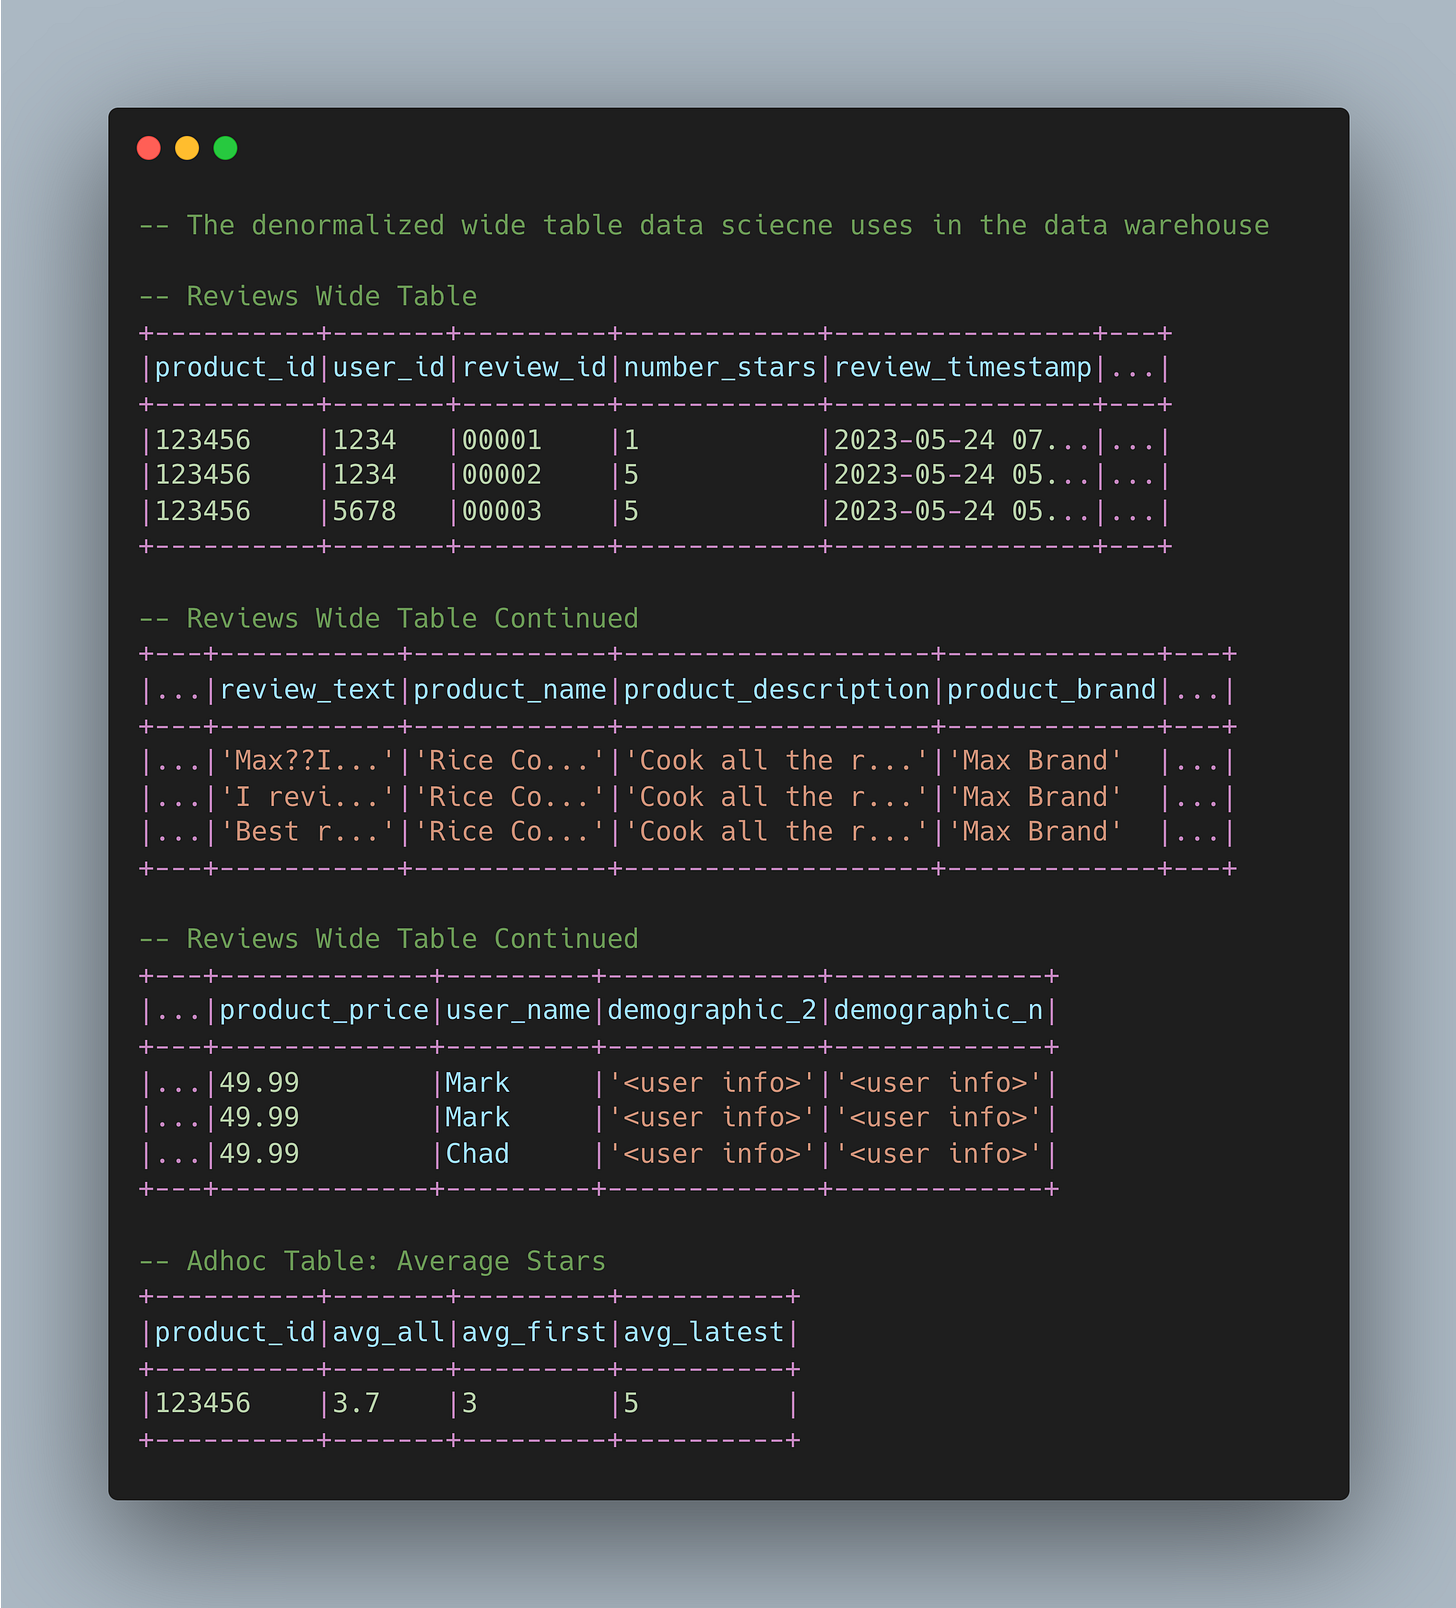
While OLTP best practices focus on 3NF for data modeling, OLAP reverses this structure to a “denormalized” form to answer questions that must scan across large swaths of data. In other words, OLAP data systems will have wide tables and numerous data transformations that don’t exist in the OLTP database— note that the data may not initially be stored as a wide table, but workflows among data consumers often lead to this format. Below is what the denormalized wide table would look like in the OLAP system utilized by Sell Online Corp’s data consumers along with ad-hoc tables:
Going back to the original business problem, “Sell Online Corp needs to present to their board how their major push for user reviews of products led to increased sales.” This deceptively simple question is extraordinarily difficult to answer as the following aspects are subjective:
What is considered a valid user?
What is considered a valid user review?
How do we calculate the average stars for a product?
At what scale of “increase” is relevant to business stakeholders?
Are user reviews driving changes in sales directly, or is there a specific relationship among various variables that lead to changes in sales (hint: it’s typically the latter)?
In the given scenario, the data is no longer utilized for straightforward CRUD operations that have explicit requirements tied to the product. Instead, the data is now used for complex analytical queries, where the requirements are refined as the comprehension of the underlying data improves. This differentiation results in a decoupling of perspectives regarding data usage between OLTP and OLAP users. This results in varied understandings of the data that eventually give rise to complexity and data quality issues.
Transformations: Where Business Logic is Stress Tested
So why do we even create this added complexity by introducing an OLAP database? Like most endeavors in data, it’s all about balancing tradeoffs where there is more value than risks to be gained from introducing complexity. In the use case of analytics workflows, data teams are able to “stress test” existing business logic to determine if the business logic is still valid, whether their underlying assumptions still hold true, or if there is additional logic that can be added or adjusted to create value. These updates to business logic is a business’s unique competitive advantage to better capture value in the market with data.
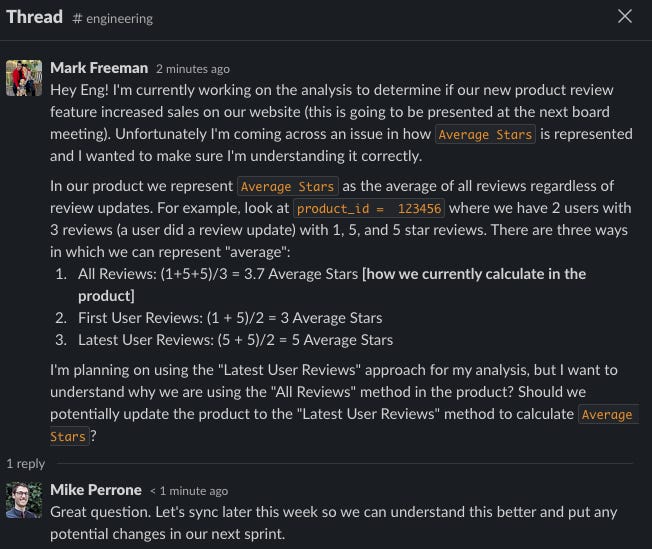
In our Sell Online Corp example above, there is a potential data quality issue related to “Average Stars” that’s not obvious at first glance until data teams in OLAP systems start unraveling the business logic. Specifically, there are three different ways to represent Average Stars that have implications for analytics. Below is a mock conversation with the engineering team at Sell Online Corp.
Now this is a very specific use case, but imagine the level of complexity in logic that can be found amongst numerous product features and workflows within a mature product. Managing this complexity becomes quite the challenge as an organization scales and iterates in different directions.
Bridging the OLTP and OLAP Divide
In our Average Stars use case, why would the OLTP side opt for a simple calculation of all average stars rather than adding the additional logic to filter to the latest reviews by a user? This goes back to HOW data is operationalized among data producers (OLTP databases) and data consumers (OLAP databases), as well as the constraints of those teams.
Within an OLTP system, data producers care about:
Building specific product features with clear requirements.
ACID compliance among the data for CRUD operations.
Reducing unnecessary complexity so that the codebase is easy to build and maintain further features for the product.
Under these constraints, a valid reason for calculating Average Stars is for simplicity within the product codebase. The use case of someone updating the review for a product is a small fraction of overall reviews for Sell Online Corp; thus the added complexity of filtering for first or latest reviews by a user was not worth it. In other words, it was a product decision over a data decision, as the OLTP database serves the product with respect to user transactions.
Within an OLAP system, data consumers care about:
Finding unique relationships among data via the use of denormalized wide tables.
Teasing out the nuances of existing business logic to see how it can be validated and or improved.
Answering complex business questions with unclear requirements via an iterative process of understanding the underlying data.
Though updated reviews account for a small fraction of overall reviews, the data teams on the OLAP side are uniquely positioned to see patterns among this usage. In the case of the OLTP side, data is organized in distinct chunks of information for transaction speed. But on the OLAP side, all the data is combined to surface interesting relationships that are not apparent in the OLTP team’s data. Specifically for Sell Online Corp, even though a small fraction of reviews are updated, the users who did update reviews were a very important population. Updated reviews were primarily on items greater than $300, as users were sensitive to perceived value for the price. In most cases, the bad reviews at this price point were later increased after the seller resolved the issue. This population accounted for a significant portion of revenue on Sales Online Corp.
Often the data producers on the OLTP side and the data consumers on the OLAP side both have valid reasons for how they view the same data differently. What matters less is which side is right, and instead, we need to focus on what tradeoffs from both sides best serve the business via data.
If you want to review a real-world use case of these tradeoffs, then I highly encourage checking out Uber Freight Carrier Metrics with Near-Real-Time Analytics | Uber Blog where they describe the pros and cons of various OLTP and OLAP configurations on their Carrier App.
Closing Thoughts
Though Sell Online Corp is a fictitious example, this mimicked my experience in the previous HR tech company I worked in. One of the early mistakes I made was going into these conversations with only the analytics perspective in mind… this method didn’t get much traction.
I became substantially more effective in my role when I left the comfort of my understanding through an OLAP lens and spent the time to understand the OLTP databases used by my data producer colleagues. I quickly learned that many of my “obvious” and “simple” asks were actually hard asks on my engineering colleagues as it increased the scope of their sprints and increased the complexity of their codebase. Such asks were a hard sell without making it clear to data producers their impact on the OLAP side used by data consumers.
Therefore, the solution to this divide between OLTP and OLAP database users is not to force the benefits of one side or the other but to instead foster empathy so that both sides can translate the needs of each other. At this HR tech job, we made great strides by including the data consumers in the product requirements document (PRD) writing phase. It worked well because we added the OLAP perspective before data producers were constrained by existing requirements to deliver a product on a tight deadline. For the data consumers, we finally had an opportunity to see upstream and learn the product constraints that impacted our business logic.
But this approach can only take you so far. Without a way to scale these conversations and enforce the agreements made during the PRD writing phase, teams eventually revert back to the issue of data producers and consumers not understanding each others’ needs after a few iterations on a product feature. This is what ultimately led me to data contracts as the avenue in which to scale and maintain the empathy between OLTP and OLAP database users. Chad has written extensively about data contracts in this newsletter— read this article to dive deeper into data contracts— but in summary, data contracts are an API that enforces agreements, between data producers and consumers, regarding expectations of data assets to prevent known data quality issues. While this article doesn't deeply cover data contracts, I encourage folks to focus less on the technical implementation of data contracts and more on their potential to foster empathy among teams and enhance cooperation between OLTP data producers and OLAP data consumers.



Congratulations for this discovery. I am surprised this is not tought in uni and bootcamps - after all this is not new insight, it has been known for at least 3 decades now.
OLAP and the "need" for denormalisation is a misconception. OLTP/OLAP refer to the physical aspect of SQL database products but underlying it we suppose the relational data model and this is the same independently of OLTP/OLAP. An "analytical table" should also be normalised (5N or 6N not 3N [or more commonly Boyce-Codd Normal Form]). The "denormalisation" might appear as an intermediate logical step (not part of the data model per se) before an aggregation (or other function) is calculated but once data is aggregated the result relation should be normalised too.